Is the liquidity picture turning?
In “Could Risk Assets Capsize In Q1-25?” I proposed a few reasons why risk assets could slide in Q1-25 and to take advantage of near-record “cheap” OTM put insurance.
Shortly after the note, risk assets slid hard and volatility went from 13 to 28 in short order.
Following the worst end to a year for equities since the mid-1950s, equities have “rebounded” to start the first week with QQQ up 1.9%, SPY up 1.8% and the IWM up 1.5%, respectively; and bitcoin regained $100k


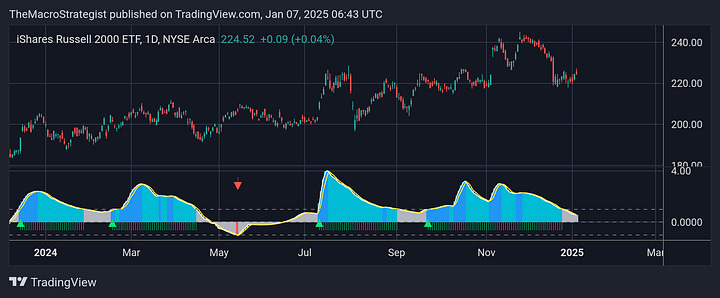
If we look at the charts above, we can put some context in recent moves higher. The 7- and 30-day rate of change in price have shifted as risk assets above bounce off -2 z-scores which are conducive to rallies; and potential support liquidity could extend the move higher following the end-of-year sell-off.


Lets look at the trend strength for the above assets. QQQ & SPY remain in bullish trend, but strength is waning. IWM still remains neutral. However, BTC went from neutral to strong bullish strength which will likely push prices back towards all-time highs.
(trend strength: dark blue is strong bullish trend, light blue is weak bullish, grey is neutral, light red is weak bearish trend with dark red indicating strong bearish trend).
Alongside risk assets, there was a bump up in liquidity metrics, so let's break that down. Where's the liquidity coming from, how's it effecting the dollar, yield curves and near-term outlook for EURUSD.


