Yield Curve Inversions and Equity Market Declines: Historical Context and Current Signals
Yield Curve Inversion and Un-inversion
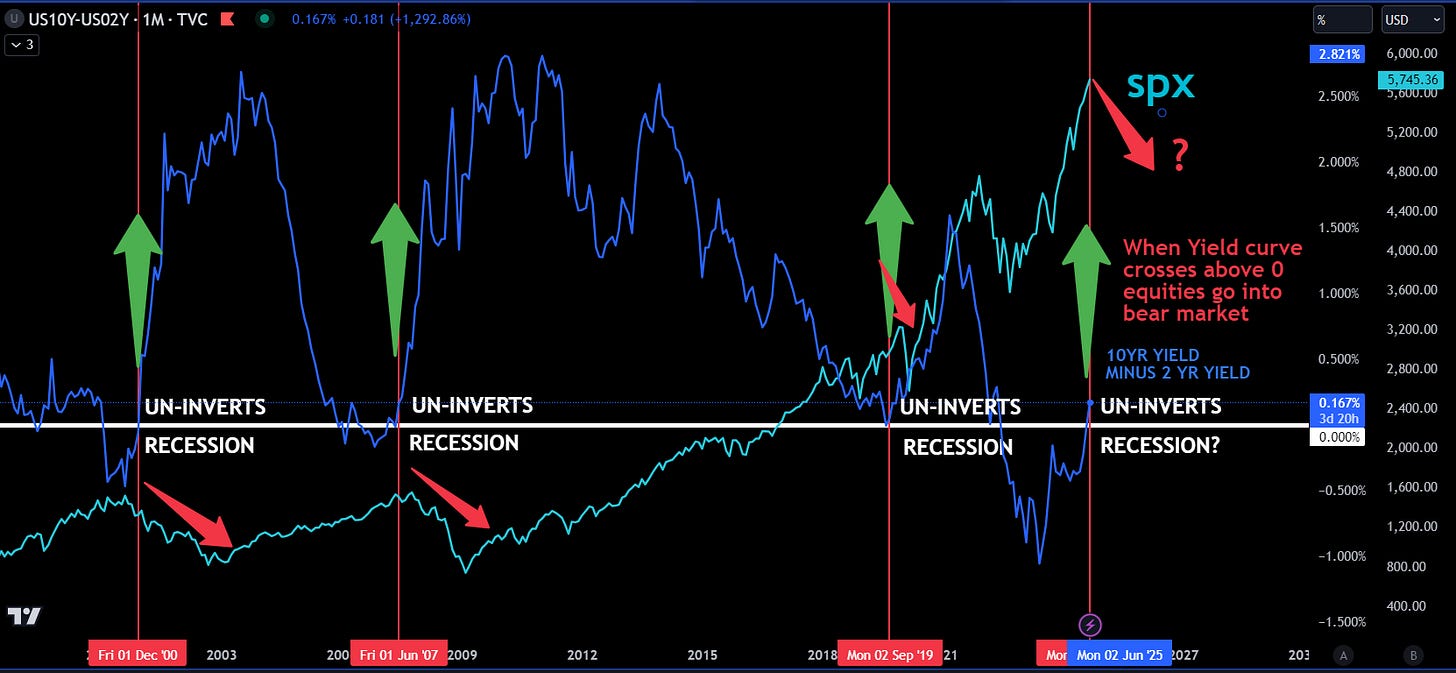
10Y-2Y Spread (Blue Line): This spread is a crucial signal of market expectations regarding economic growth and interest rate policy. Typically, when the yield curve inverts (i.e., the 2-year yield is higher than the 10-year yield), it signals that investors expect slower economic growth or even a recession. The chart highlights multiple instances where the yield curve has inverted (i.e., fallen below zero) and then un-inverted as the spread returned to positive territory.
Historically, after the yield curve un-inverts and crosses back above zero, equity markets tend to enter a bear market, and longer-duration bonds (e.g., TLT) rally as investors seek safe-haven assets.
S&P 500 Performance
SPX (Green Line): The S&P 500’s performance around the periods of yield curve inversion and subsequent un-inversion is critical. In previous cycles (2000, 2007, and potentially now in 2024), the un-inversion of the yield curve closely coincides with the onset of a recession and a sharp decline in equity markets.
For instance, in 2000 and 2007, when the yield curve un-inverted after a prolonged period of inversion, the equity market entered a bear market shortly after, as indicated in the chart. The yield curve typically un-inverts when the Federal Reserve begins cutting rates, often in response to a weakening economy or financial instability, which then prompts a market sell-off.
As of now, the yield curve has Un-inverted, similar to what was observed prior to previous recessions. This raises concerns about a potential economic downturn on the horizon.
The S&P 500 has been rallying despite the yield curve-uninversion, but the risk of a bear market grows as we go further past the un-inversion point. The chart suggests that when the yield curve crosses above zero, equities may face significant downside risk, mirroring past patterns.
The relationship between yield curve un-inversion and U.S. 10-year Treasury yields is pivotal in understanding the broader economic landscape. When the yield curve un-inverts—meaning the spread between the 2-year and 10-year Treasury yields moves from negative back to positive—it typically signals a turning point in the economic cycle. As the yield curve begins to un-invert, it often indicates that shorter-term rates are declining faster than longer-term rates, reflecting the market's expectation of economic weakening or an imminent recession.
Historically, during periods of un-inversion, U.S. 10-year yields tend to decline as investors flock to the safety of longer-term bonds, anticipating future Federal Reserve rate cuts or a broader easing of monetary policy. This decline in 10-year yields, in turn, tends to reinforce the slowdown narrative, further supporting the bond market while adding downward pressure on equity markets as recession fears mount. The un-inversion of the yield curve has therefore been a reliable predictor of falling 10-year yields and broader economic stress.
How to profit


