


The Macro Brief: Japanese Treasury Flows Signaling Eurodollar Trouble
Where Macro Meet Markets

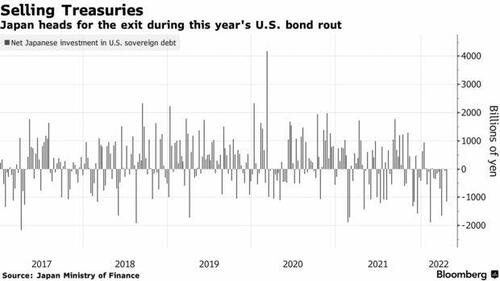
This chart has made the rounds, and what it shows is the Japanese net flows of U.S. Treasuries. It’s important because Japan is the second largest holder of U.S. bonds behind China. Interesting, right?
Now, much of this has been chalked up to Japanese pension funds selling Treasuries due to cross-currency hedging expenses, which is true but unlikely the entire story.
The hedging costs make make “redistribution,” or reinvestment of dollars, a bit costly. So, these dollars must be shaped with someone.
First, if we talk a look at net flows, what we notice going over the last year it maps repo fails. Selling of Treasuries seem to occur late Q1 and early Q4, and that is surrounding large spikes in repo fails. I covered repo fails here.
This is important because 1) Tokyo is a huge eurodollar system hub 2) The PBOC cannot liquidate large amounts of their Treasury holdings due to structural balance sheet issues.
To learn more about this chart and the rest of The Macro Strategist Pro offering, please subscribe and share!