


Diverging Signals from Bonds and Equities Point to Rising Risks for Portfolios
In recent weeks, financial markets have displayed increasing volatility, with significant movements in both bond yields and equities. As shown in the accompanying chart, U.S. Government Bonds 2-Year Yield, the Federal Funds Rate, and the S&P 500 (SPX) are providing critical insights into the current macroeconomic landscape—and the implications for investor portfolios.

Bond Market: 2-Year Yield Decline Signals a Shift
The 2-Year U.S. Treasury yield (blue line) has been a key indicator throughout the Federal Reserve's aggressive rate hike cycle. In response to rising interest rates, the 2-year yield surged, pricing in tighter monetary conditions. However, recent declines suggest a potential shift in expectations, with the bond market already have anticipated the end of the tightening cycle perhaps reading a coming economic slowdown.
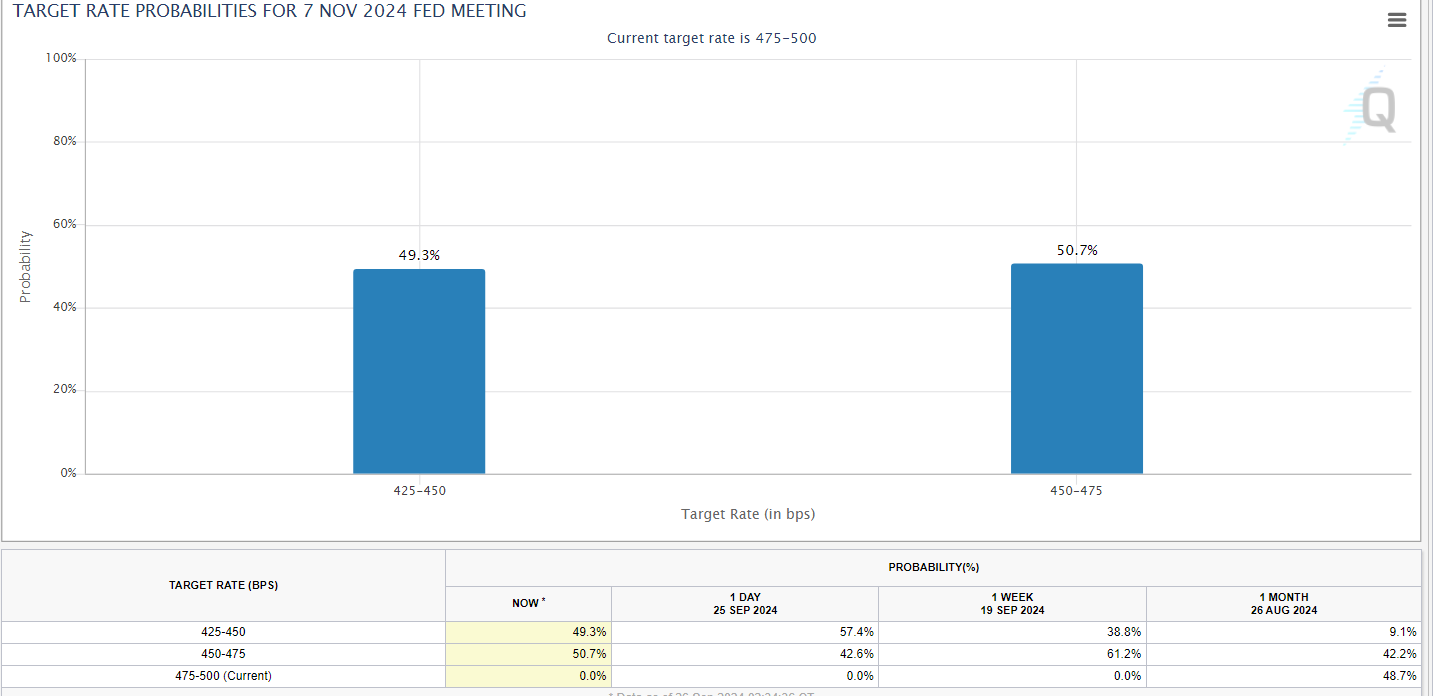
The bond market’s sensitivity to monetary policy is crucial here. The Fed Funds Rate (red line) dropped by 50 basis points (not yet updated on the chart), reflecting the Federal Reserve's shifting focus from taming inflation. But with 2-year yields easing, markets signalled a potential pivot weeks ago in what could be signs of economic weakness on the horizon, perhaps from rates being too restrictive. At the time of writing the market is pricing in a 50% chance of a 50 basis point cut in the next meeting.
This divergence between the bond and equity markets is critical. While bond yields are signaling that rates are on their way down, equity markets are grappling with the reality of tighter financial conditions and the implications for corporate profitability. Investors appear to be re-evaluating risk in the face of slower growth, rising financing costs, and potential downward revisions in earnings expectations.
Historical Fed Rate Cut Cycles – Economic Indicators

This table provides a historical breakdown of key economic indicators during past Fed rate-cut cycles, with a focus on unemployment, GDP growth, and debt-to-GDP ratios. The table differentiates between cycles that avoided recessions (highlighted in green) and those that did not, offering insights into the broader economic conditions surrounding each cycle.
In cycles where recessions were avoided, economic fundamentals were gerally stronger at the time of the first rate cut, with lower unemployment and healthier GDP growth. For instance, the 1966 and 1984 cycles saw significant reductions in unemployment and positive GDP growth, allowing the economy to weather the rate cuts without tipping into recession.
The current cycle (2023-2024) shows higher debt-to-GDP ratios and slower growth compared to historical averages, raising concerns about whether the economy can avoid a recession following the first rate cut. This suggests that the current economic environment may be more vulnerable to downside risks, and investors should remain cautious.
S&P 500 Performance Following Fed Rate Cuts
Equity markets have historically responded positively to the initial phase of Federal Reserve rate-cutting cycles, but this response is highly contingent on broader economic conditions. The chart illustrates S&P 500 performance surrounding the first rate cut across different historical cycles and underscores a critical distinction: whether or not a recession follows within the next 12 months.

When the economy avoids a recession post-cut, the S&P 500 typically rallies, delivering a robust 15% median return over the next year. This trend suggests that investors perceive rate cuts in these environments as proactive, supporting liquidity and fostering growth, which drives equity prices higher. The blue trajectory shows a steady increase after rate cuts, indicating investor confidence in economic stability and continued earnings growth.
However, the story is markedly different when a recession follows the rate cut. In cases where the economy slips into recession (grey line), equity markets have struggled to rally, with the S&P 500 posting negative returns of around 10% to 20%. In these scenarios, the fundamental weakness in the economy—rising unemployment, declining earnings, and shrinking corporate investments—outweighs the benefits of easier monetary policy. Rate cuts, in this case, often signal deeper issues that monetary easing alone cannot resolve.
The current cycle (green line) shows the S&P 500 already experiencing gains in anticipation of a potential rate cut. This trajectory is reflective of market optimism that the Fed’s monetary easing could stave off a hard landing. However, whether this optimism persists will depend on whether the economy can avoid slipping into a recession.
For investors, this chart highlights the importance of context. Rate cuts can boost equity markets, but only if the economy avoids deeper structural issues. If a recession materializes, the likelihood of a sustained equity rally diminishes, making caution a prudent strategy in the early stages of a rate-cutting cycle.
S&P 500 Performance During Fed Rate Cuts – No Recession Scenario

In this chart, we see the S&P 500’s historical performance in cycles where the Fed has cut rates, but the economy has avoided a recession, specifically in 1995, 1998, and 2019. In these cases, rate cuts provided a boost to equities, with the S&P 500 rallying significantly after the initial cut.
The chart suggests that when rate cuts are implemented in the absence of a recession, the equity market tends to respond positively. This is likely due to the Fed's ability to stimulate growth by reducing borrowing costs, while the underlying economy remains strong enough to support continued earnings growth. In these cases, the S&P 500 has experienced a sustained rally, with gains extending for months or even years following the first cut.
For the current market, this historical pattern suggests that if the Fed cuts rates without triggering a recession, equities could continue to perform well, with the S&P 500 potentially following a similar trajectory to the 1995, 1998, or 2019 cycles.
S&P 500 Performance During Fed Rate Cuts – With Recessions

This chart highlights the S&P 500's performance during Fed rate-cutting cycles where the economy eventually fell into a recession, specifically looking at the 2001 and 2007 cycles. In these cases, the rate cuts did not prevent significant market downturns, as the economy weakened despite the Fed’s efforts to provide monetary stimulus.
In both the 2001 and 2007 cases, the S&P 500 continued to decline following the first rate cut, as the underlying economic conditions deteriorated. This serves as a warning that rate cuts, while often supportive of equity markets in the short term, may not be enough to offset the damage caused by a deep economic recession.
For investors, this chart emphasizes the importance of monitoring the broader economic environment. If recessionary pressures build, the market’s response to rate cuts may be muted, and the S&P 500 could experience further downside even as the Fed eases monetary policy.
Small-Caps vs. Large-Caps After Fed Rate Cuts

This chart illustrates the relative performance of small-cap stocks versus large-cap stocks following Fed rate cuts, showing that small caps tend to outperform large caps in the 6 months following the cut. However, the performance is more mixed in the immediate aftermath (1-3 months), where large caps often perform better.
Small caps generally benefit more from falling interest rates, given their greater reliance on credit and financing for growth. As rates drop, smaller companies often see greater improvement in borrowing conditions, which helps their relative performance. This explains the relative outperformance of small caps in longer periods after the rate cut.

For investors looking to position portfolios post-Fed rate cuts, small caps may offer more upside, particularly once the full benefits of looser monetary policy are felt. However, the initial underperformance suggests a more cautious approach may be warranted in the early stages of a rate-cutting cycle.
Sector Performance Following Rate Cuts

This table breaks down the performance of different S&P 500 sectors in the six months following the first Fed rate cut in various cycles. Historically, utilities and consumer staples have been the top-performing sectors following rate cuts, reflecting their defensive characteristics and ability to perform well in low-interest-rate environments.
In contrast, more cyclical sectors, such as materials and energy, have shown more mixed performance, depending on broader economic conditions. Technology has been particularly volatile, with significant gains in some cycles and notable underperformance in others, highlighting the sector’s sensitivity to changes in monetary policy and growth expectations.
For investors, the takeaway is clear: defensive sectors like utilities and staples tend to outperform in the immediate aftermath of rate cuts, while cyclical sectors may offer more upside in longer-term economic recoveries.
Gold and Federal Funds Rate Relationship

This chart tracks the relationship between gold prices and the Federal Funds Rate from 2000 to 2024. It highlights the inverse correlation between monetary easing and gold’s performance. Specifically, when the Fed initiates rate cuts, gold prices tend to rise, reflecting gold’s status as a safe-haven asset and a hedge against inflation.
In past cycles, we’ve seen substantial gold price increases when the Federal Reserve cut rates aggressively. During the 2001 and 2008 cycles, for example, gold appreciated by 31% and 39%, respectively, as the Fed lowered rates to stimulate economic recovery following recessions. More recently, during the COVID-19 pandemic, gold rose by 5%, benefiting from the Fed’s rapid rate cuts and flight-to-safety demand.
This pattern demonstrates that gold tends to rally during periods of monetary easing, driven by falling real interest rates, rising inflation concerns, and heightened uncertainty. Looking forward, should the Fed shift from its current tightening stance to a more accommodative one, gold could see another upward trajectory as investors seek refuge from declining real yields and potential market volatility.