Sustained Uptrend with Two Major Rallies
As of September 2024, the SPY ETF is trading at $562, marking a continuation of its uptrend and resting comfortably above the 200-day moving average (blue line), a critical indicator of long-term market health. The consistent upward trajectory highlights robust sentiment in large-cap U.S. equities, with no significant signs of weakening at this point.
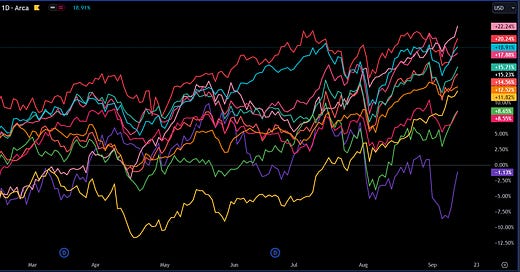
So far in 2024, Utilities (+22.24%) and Communication Services (+20.24%) are the top-performing sectors, benefiting from defensive positioning and digital transformation trends. Financials (+17.88%) and Industrials (+15.71%) have also shown strong gains, supported by rising interest rates and infrastructure spending. Meanwhile, Health Care (+12.52%) and Consumer Staples (+15.23%) continue to offer stability, appealing to risk-averse investors.
At the lower end, Consumer Discretionary (+8.65%) and Materials (+8.55%) show more modest gains, reflecting mixed economic sentiment. Metals & Mining (-1.13%) is the only sector in negative territory, dragged down by global demand concerns. Overall, the year-to-date performance highlights the importance of selective sector rotation in capturing returns across different market conditions.
Breadth Indicators: Gauging Market Strength Across Timeframes
The three key breadth indicators displayed below the SPY chart reflect the percentage of S&P 500 stocks trading above their respective moving averages—providing insights into market participation across different timeframes.
Top Line (Magenta): % of S&P Stocks Above Short Term Moving Average
This indicator shows the short-term market breadth, and as of September 2024, it stands at 63.22%. This suggests that 63% of the stocks in the S&P 500 are in short-term uptrends. Although this is a healthy reading, it has come off recent highs, indicating some near-term consolidation in the broader market. However, with a majority of stocks still trading above their short term average, the short-term outlook remains constructive, though slightly vulnerable to minor pullbacks.Middle Line (Purple): % of S&P Stocks Above Medium Term Moving Average
The mid-term breadth indicator is currently at 71.76%, indicating strong participation from S&P 500 stocks in the intermediate-term uptrend. Historically, when over 70% of stocks are trading above their medium term moving average, it suggests robust market conditions, typically associated with sustained rallies. This broad level of participation across the index reinforces the bullish case and suggests that any near-term corrections may be shallow.Bottom Line (Purple): % of S&P Stocks Above Long Term Moving Average
The longer-term breadth indicator shows that 71.76% of S&P 500 stocks are trading above their long term moving average, matching the mid-term breadth figure. This consistency across both the medium and long term measures indicates that the current market rally has strong support, not just in the short term, but across broader timeframes. The long-term health of the market remains intact, with over 70% of stocks in solid uptrends.
Key Insights
Strong Market Participation: The percentage of stocks trading above their medium and long term moving averages is over 70%, which signals broad-based market strength. This suggests that the rally is not being driven by a small subset of stocks but rather has widespread participation across the index.
Short-Term Consolidation: The short term breadth indicator has pulled back slightly to 63%, which may signal some short-term consolidation. However, the majority of stocks remain in positive trends, and this pullback may simply reflect a pause before the next leg higher.
Sustained Uptrend in SPY: The SPY ETF continues to trend well above its 200-day moving average, reinforcing the long-term bullish outlook. Investors should monitor this level, as it often serves as a key line of defence in market corrections.


