


Market Breadth Triggers S&P 500 Buy Signal
Buy The Dip?

Introduction
The stock market is often described as a complex mechanism of interconnected indicators, with market breadth serving as one of its most telling signals. Today, we examine a significant development: a market breadth trigger indicating a buy signal for the S&P 500. This analysis breaks down the current state of major indices, key sector performances, and their implications for the broader market.
Indices and Equal-Weight Indices
To understand the market’s trajectory, it’s crucial to evaluate both the cap-weighted indices and their equal-weighted counterparts.
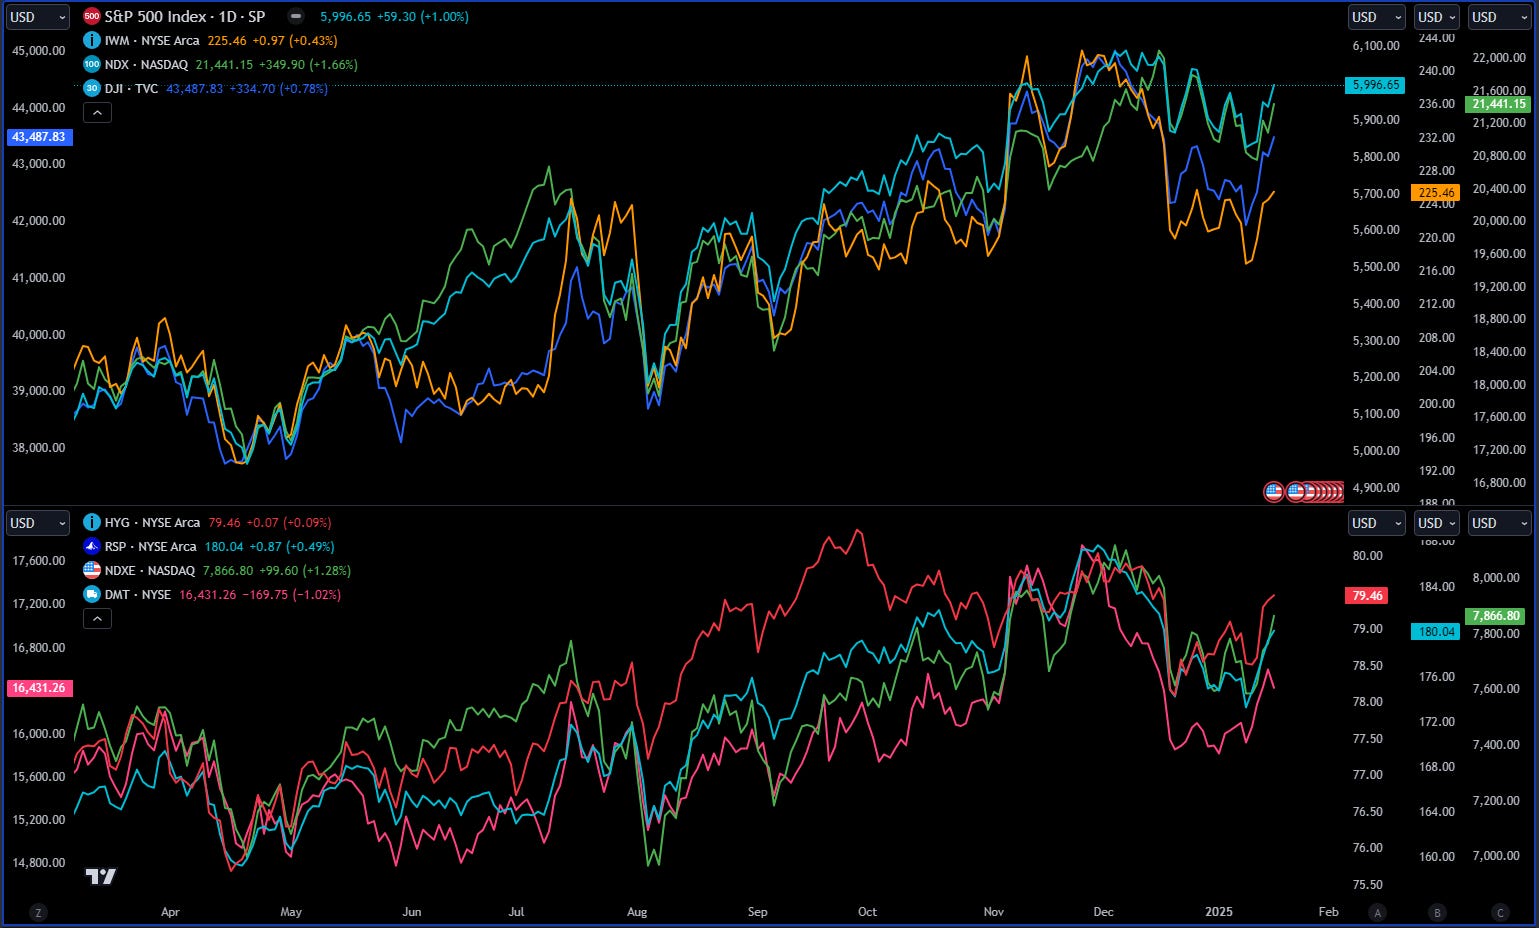
The top chart showcases the movements of the S&P 500, NASDAQ, Dow Jones, and Russell 2000. Despite recent volatility, these indices have demonstrated resilience, hinting at growing investor confidence.
Notably, the equal-weighted S&P 500 (RSP) provides a unique lens, revealing whether smaller constituents are participating in the rally. Divergence or convergence between RSP and SPX is often a leading indicator of market strength or fragility.
The inclusion of high-yield corporate bonds (HYG) and Dow Transports (DMT) further complements this analysis. Dow Transports, widely regarded as a barometer of economic activity, underscores improving sentiment in cyclical industries. Meanwhile, HYG's performance reflects risk appetite, an essential factor for confirming bullish momentum.
Sector ETF Analysis
The sector-level performance adds depth to the story. As illustrated in the sector ETF chart:

Leaders like XLB (Materials) and XLE (Energy) have surged ahead, with gains of 6.15% and 4.91%, respectively. This signals a renewed focus on cyclicals, a hallmark of early-stage bull markets.
Defensive sectors like XLP (Consumer Staples) have lagged, a sign that risk appetite is shifting away from safety toward growth.
The divergence between technology-heavy XLK and materials-heavy XLB highlights the rotational dynamics shaping this market phase.
Tracking sector ETFs offers invaluable insights into which industries are driving broader indices and whether this leadership aligns with historical bull market trends.
3. Market Breadth Signal
The decisive factor in this bullish case is the market breadth signal, which incorporates several key metrics: The prior signal led to a 10% rally in the S&P 500

SIGNAL DETAILS: