Divergence Everywhere
Divergence Everywhere
A look under the surface of markets

The recent rally in the US stock market has been impressive, but a closer look under the hood reveals a potential cause for concern: divergence between major market indexes and key market breadth indicators.

These divergences can be cause for caution.
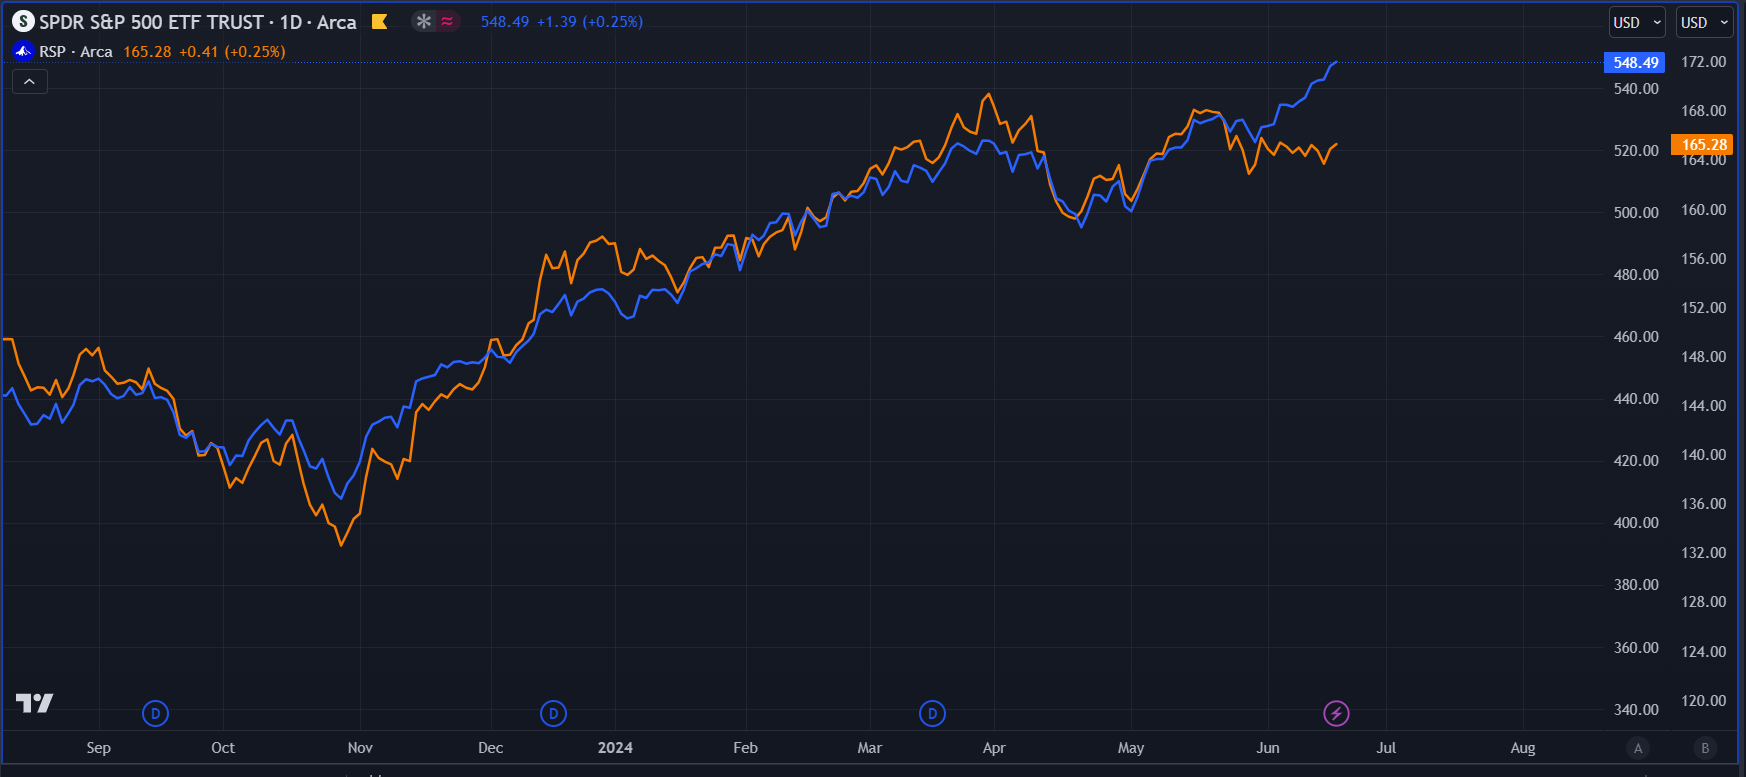
The chart above reveals a clear divergence between the traditional S&P 500 (SPY) and its equal-weight counterpart. While SPY continues its upward climb, the Equal Weight SPY remains flat or even dips slightly.
This suggests that the recent market gains might not be as broadly distributed as they appear. Dominant performance from a limited number of large-cap stocks could be driving the SPY higher, while the majority of companies in the index are experiencing stagnant or negative returns.
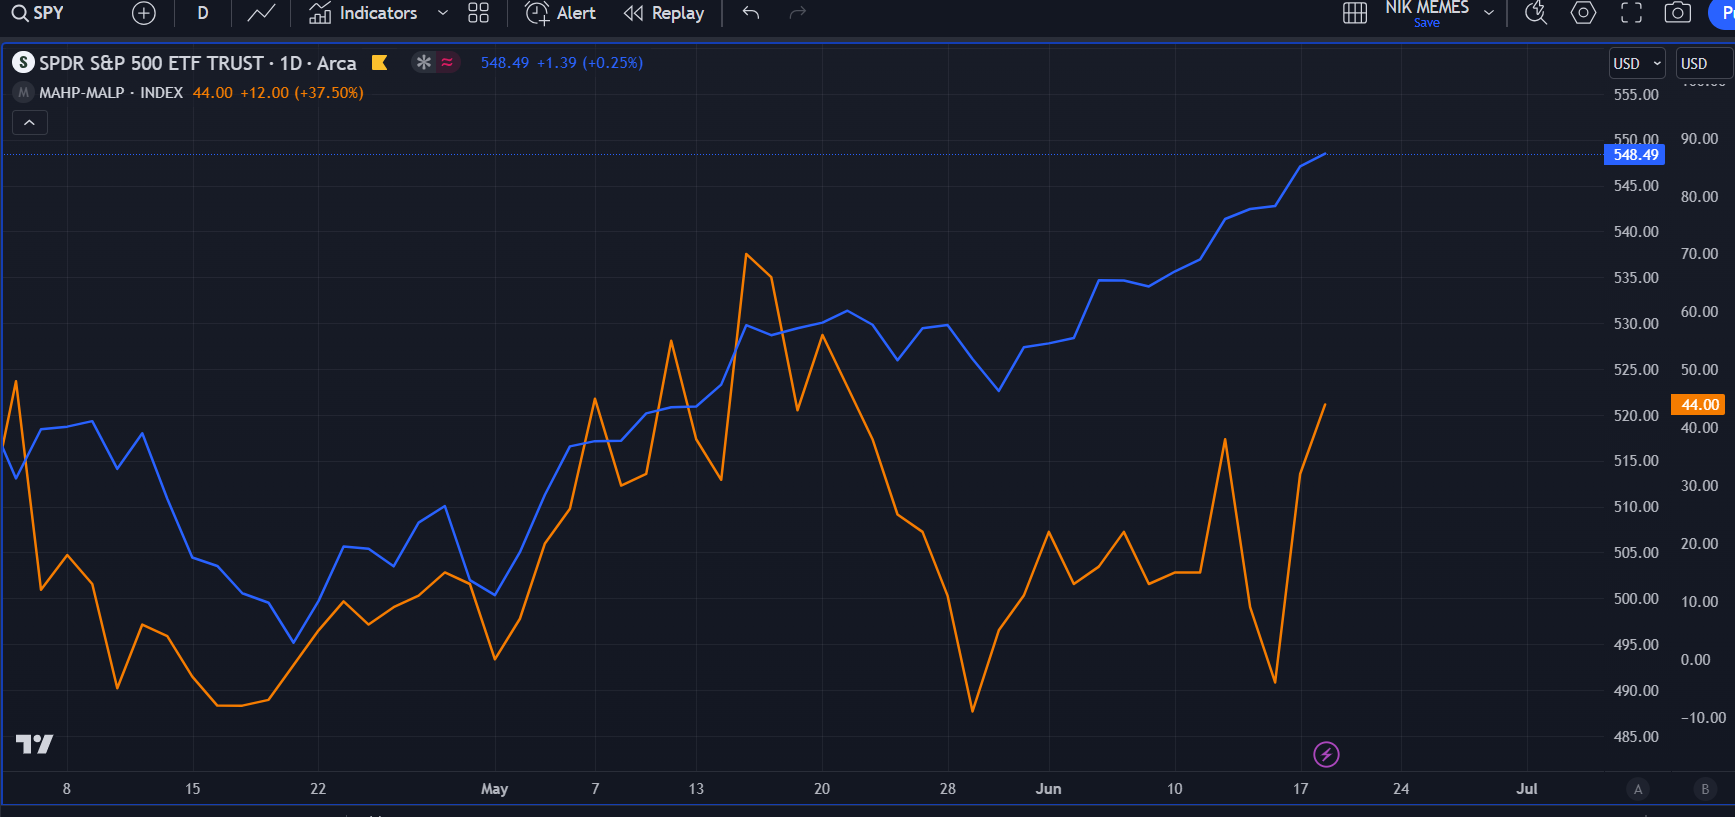
The chart above paints a contrasting picture of the US market. The S&P 500 (SPY) is scaling new all-time highs, indicating a strong overall market rally. However, the divergence in the new highs minus new lows (NHNL) line tells a different story. The NHNL line, which tracks the difference between stocks reaching 52-week highs and lows, is forming a lower high.
This suggests that the rally might be concentrated in a select few stocks, while the broader market participation is waning. This divergence is a potential warning sign and could indicate a loss of momentum in the near future.
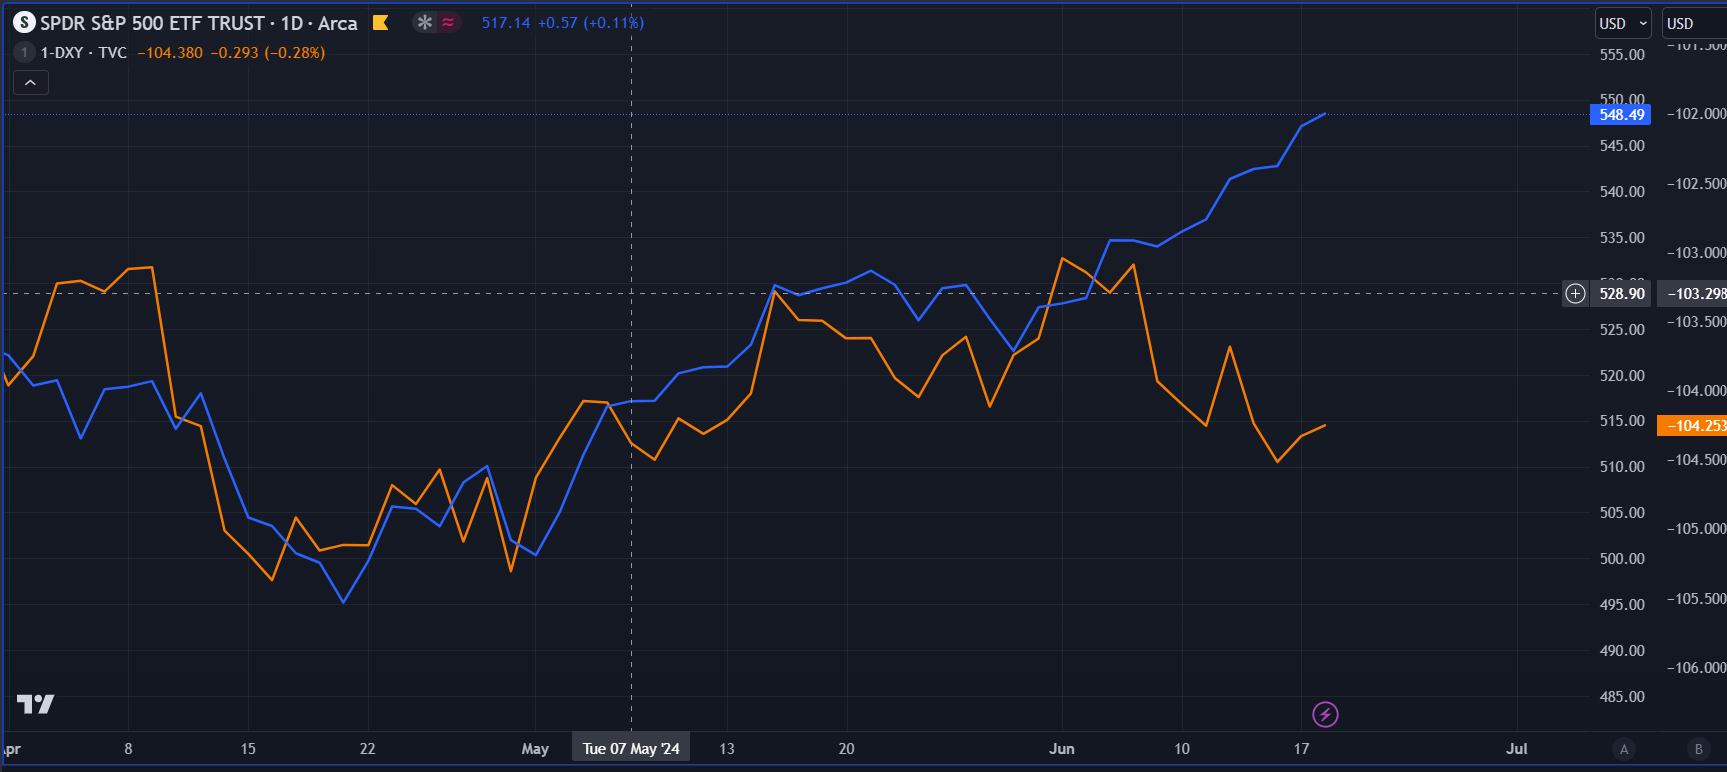
The chart above reveals a curious disconnect between the US stock market and the US dollar. The S&P 500 (SPY) is powering higher, reaching new peaks. This bullish run seems at odds with the strengthening US dollar, represented by the breakdown in the inverted US Dollar Index (DXY). A strengthening dollar typically puts downward pressure on US equities as it makes exports more expensive and reduces the value of overseas earnings for multinational companies.
This divergence presents an interesting puzzle: the stock market appears to be anticipating a weaker dollar, yet the inverted DXY's breakdown signifies the opposite. It'll be interesting to see if the stock market's strength can be maintained if the dollar continues to gain ground.
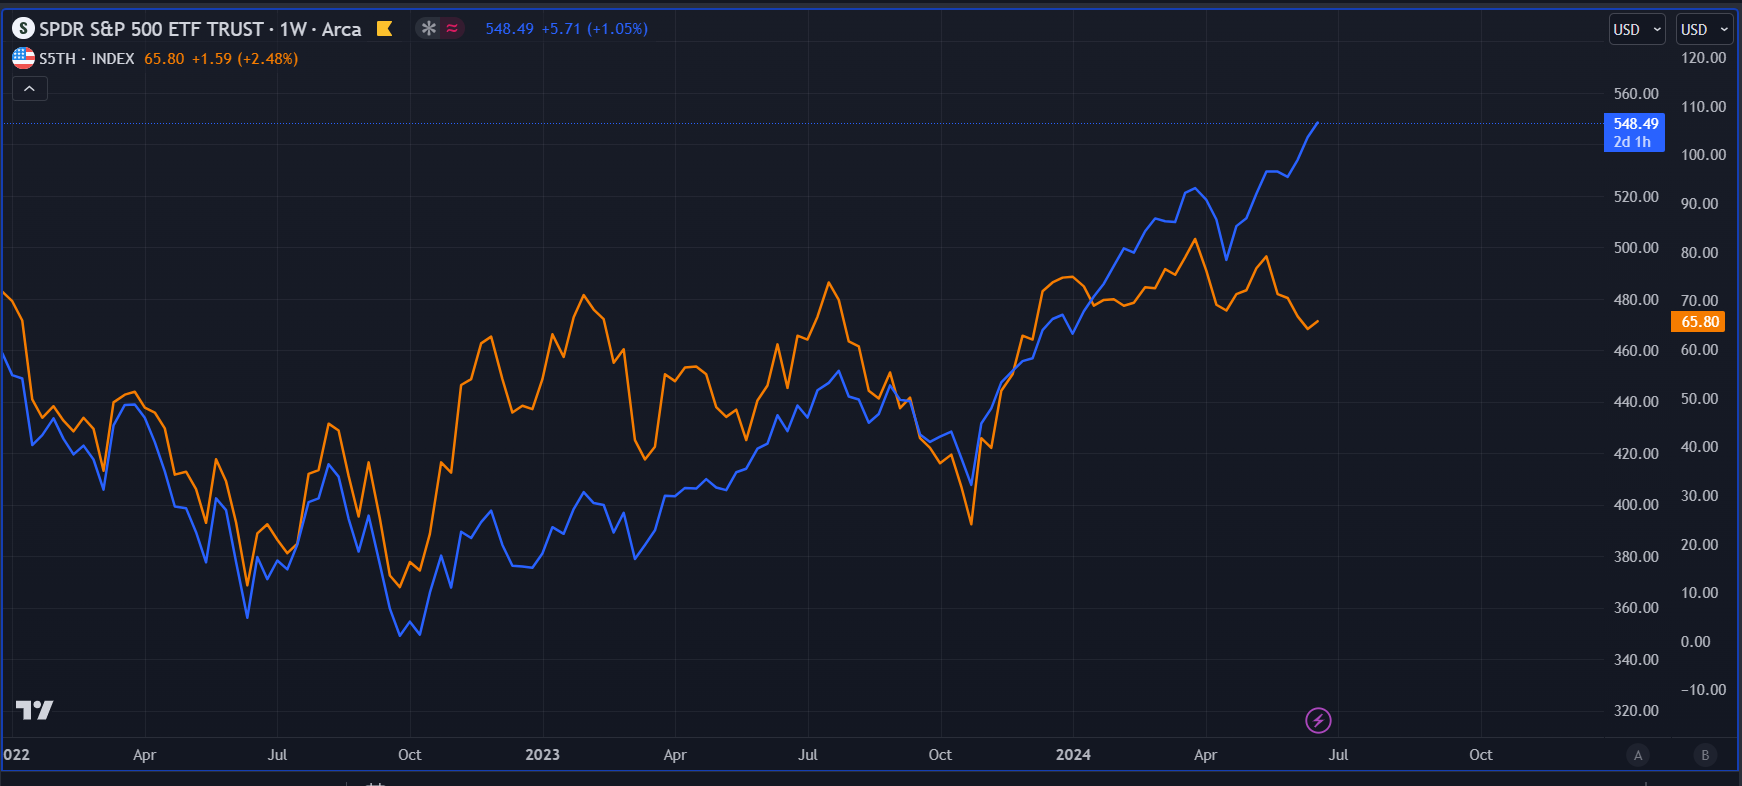
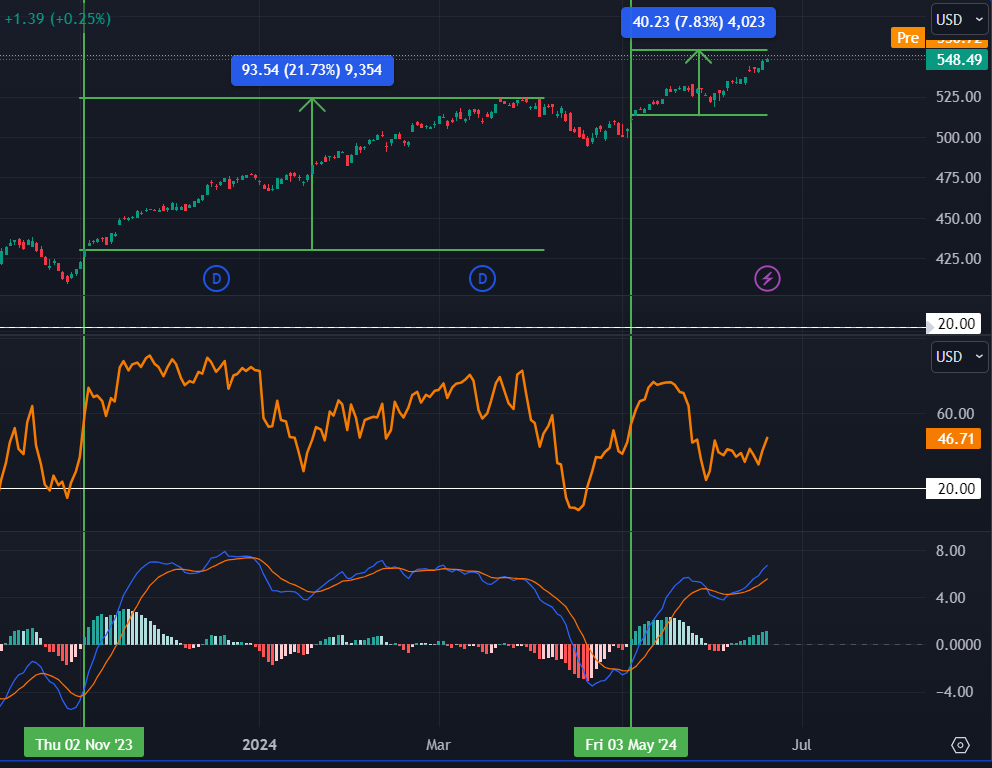
The chart above depicts a potential warning sign for the US stock market. The S&P 500 (SPY) is making fresh highs, indicating a strong overall market rally. However, the declining percentage of stocks trading above their 200-day moving average paints a concerning picture. This metric reflects the breadth of the market participation.
A downtrend in this indicator suggests that fewer stocks are participating in the rally, and the gains are concentrated in a select few. This can be a sign of waning market health and potential vulnerability in the near future, even though the headline index, the SPY, is reaching new highs.
Divergences can run for sometimes months, but they do mean revert, although I am not bearish, I do expect a pullback and I will be a buyer into that pullback.

Stay tuned for my market breadth timing tool, available for paid subscribers, designed specifically for buying market pullbacks Previous signals have given 20%+ winners.