


DEMOGRAPHICS, DEBTS & DEVALUATION
The Trend Is Print.

The United States is experiencing a significant demographic shift, with the population aged 65 and older projected to increase from 58 million in 2022 to 82 million by 2050, representing a 47% rise. This age group is expected to constitute 23% of the total population by mid-century, up from 17% in 2022.

Economically, an aging population presents several challenges. As more individuals retire, the growth of the labor force slows, potentially leading to a decrease in Gross Domestic Product (GDP) growth. Additionally, the ratio of working-age individuals to retirees is declining; in 2024, there were 2.9 people aged 25-64 for every person over 65, a figure projected to fall to 2.2 by 2054. This shift places increased financial pressure on social support systems like Social Security and Medicare, as a smaller base of workers supports a growing number of beneficiaries.
Healthcare expenditures are also expected to rise, given that older adults typically require more medical services. Between 1966 and 2023, the number of people qualified for Medicare tripled to nearly 65 million, with 10 million seniors and disabled individuals added from 2013 to 2023.

This chart visually encapsulates the macroeconomic implications of the U.S. aging population through four key trends:
Declining Population Growth (Blue Line) – U.S. population growth has been structurally slowing, reducing the natural expansion of the labor force. A shrinking working-age population places long-term constraints on economic growth and tax revenue generation, exacerbating fiscal pressures.
Falling Labor Force Participation (Yellow Line) – The labor force participation rate has been in secular decline, reflecting the demographic shift as more Americans retire. With fewer workers supporting a growing retiree population, economic productivity weakens, and wage pressures may rise due to labor shortages.
Rising Government Debt as a % of GDP (Red Line, Inverted) – The mounting fiscal burden of Social Security, Medicare, and other entitlement programs is contributing to an increasing debt-to-GDP ratio. As the dependency ratio worsens, fiscal deficits are likely to persist, raising concerns about debt sustainability.
Rising Liquidity (Cyan Line, Inverted) to Support Debt Growth – To offset the economic drag and sustain debt issuance, U.S. liquidity conditions have been accommodative. This suggests that monetary policy is indirectly responding to demographic-driven fiscal stress, potentially leading to structural disinflationary pressures.
Global Liquidity: The Hidden Engine Behind Asset Prices
As governments grapple with the economic drag from an aging population, they have increasingly relied on fiscal expansion—higher government spending financed by rising debt—to counteract the demographic-driven slowdown in GDP growth. However, with debt levels reaching historic highs, the system requires a parallel expansion in liquidity to sustain this framework.
1. The Fiscal-Liquidity Connection
The U.S. government debt as a percentage of GDP has been steadily rising, reflecting the growing burden of entitlement spending.
To prevent an outright contraction in economic growth, central banks have maintained ample liquidity conditions—even when inflation temporarily disrupted this trend.
Global liquidity, as measured by central bank balance sheets, has been on an upward trajectory, reinforcing risk-asset performance.
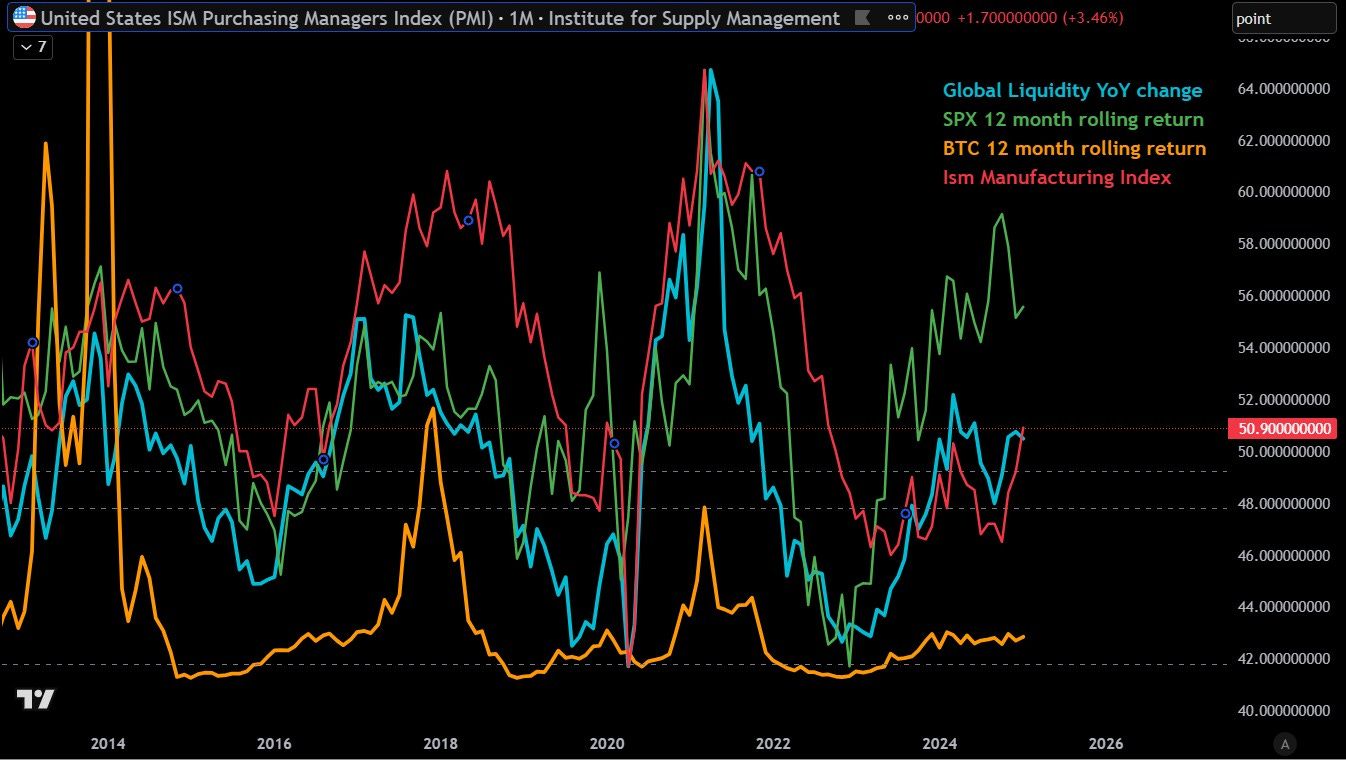
2. Liquidity Drives Markets
The chart above illustrates the relationship between global liquidity (blue line) and major risk assets:
SPX (green line, 12-month rolling return): Stock market performance shows a strong correlation with liquidity expansion.
Bitcoin (orange line, 12-month rolling return): As a high-beta asset, Bitcoin exhibits an amplified response to changes in liquidity.
ISM Manufacturing Index (red line): The real economy, while benefiting from liquidity injections, exhibits a lagging and less direct correlation compared to financial assets.
This dynamic underscores an important reality: monetary liquidity is increasingly being used as a tool to offset the economic drag from demographics, rather than purely for countercyclical economic stabilization. The need for persistent liquidity expansion raises concerns about asset bubbles, the sustainability of debt, and potential currency debasement over the long term.
Liquidity as the Central Bank’s Primary Tool
Historically, central banks have deployed liquidity injections during recessions and financial crises to stabilize the economy. However, in recent years, liquidity has also played a critical role in ensuring smooth government debt rollovers, as rising fiscal deficits have necessitated increasing debt issuance. When private demand for sovereign bonds weakens, central banks step in as buyers of last resort—either through outright purchases or through indirect market interventions.
In 2025, the U.S. Treasury faces a major refinancing wall, with approximately $7 trillion in debt maturing. As bond yields have marched higher, the cost of rolling over this debt has increased, raising concerns about debt sustainability and the need for liquidity injections.

U.S. Treasury Debt Maturity Profile
How Liquidity is Expected to Move in 2025
Given the scale of upcoming debt issuance, the Federal Reserve and other major central banks will likely face a delicate balancing act—either allow rates to rise further, potentially triggering market instability, or inject liquidity preemptively to smooth out the refinancing process. If liquidity is not added ahead of time, markets could experience liquidity stress before policymakers eventually intervene.
Historically, whenever central bank balance sheets expand, risk assets tend to respond positively. The relationship between global liquidity and asset prices is evident in the following chart, which shows how expansions in central bank balance sheets have coincided with highs in equity indices, Bitcoin, and gold, while liquidity contractions have been associated with market corrections.

Global Liquidity and Asset Price Correlation
This underscores a key theme for 2025: Liquidity remains the primary driver of risk assets, and the market's trajectory will likely be dictated by whether central banks act preemptively or reactively in response to the markets demand for global liquidity.
FX, Interest Rates, and Global Liquidity
As global liquidity expands, its impact is not limited to equities and risk assets—it also affects major FX pairs, the U.S. dollar (DXY), and bond yields. The chart below illustrates the relationship between global liquidity (blue), EUR/USD (yellow), GBP/USD (red), the inverse DXY (green), and the U.S. 10-year yield (white).

FX & Global Liquidity Correlation
DXY and Global Liquidity: Historically, rising liquidity tends to weaken the U.S. dollar, as excess capital flows into riskier assets. A liquidity expansion often correlates with strength in EUR/USD and GBP/USD, reflecting increased global risk appetite.
U.S. 10-Year Yield: While bond yields are primarily influenced by inflation expectations and central bank policy, liquidity injections tend to suppress yields in the short term by easing financial conditions. However, if inflation resurfaces, long-term rates could move higher despite liquidity support.
Risk-On vs. Risk-Off: When global liquidity contracts, the dollar tends to strengthen as investors move into cash and Treasuries, while risk currencies like the euro and pound weaken. Conversely, during liquidity expansions, we typically see broad-based USD weakness and a reflationary environment for risk assets.
Conclusion: The Liquidity-Driven Market Cycle
The aging U.S. population is placing structural constraints on economic growth, leading to an increasing reliance on debt and liquidity injections to maintain GDP expansion. As government debt levels rise, central banks are forced to intervene preemptively by adding liquidity to ensure smooth debt rollovers and prevent systemic shocks.
The key takeaway for investors is clear: Liquidity remains the dominant macro force.
Risk assets, including equities and Bitcoin, are highly sensitive to global liquidity cycles.
Sovereign bond yields may experience short-term suppression from liquidity injections but could rise structurally if inflationary pressures persist.
FX markets reflect the broader risk-on/risk-off environment, with DXY acting as a counterweight to global liquidity trends.
Looking ahead, the 2025 debt rollover will be a critical test for financial markets. If liquidity is not added preemptively, we could see liquidity stress and volatility before an eventual policy response. However, history suggests that once liquidity injections resume, risk assets tend to respond positively.
This dynamic reinforces a simple but powerful market truth: Liquidity drives everything.