


Curves Sniff Out Lower Inflation While Oil Longs Hit Record Lows, Gold $3,300
Are you not entertained?

“If we look at the futures curve we see the front of the curve calendar spreads fall dramatically on the back of of record U.S. production.
For those that follow me on X (The_Macro_Brief), you're well aware of my viewpoint on OPEC+ oil cuts.
First, OPEC+ fundamentally cuts production into demand weakness in order to tighten markets. Second, U.S. production is compensating from cuts by OPEC and Russia.” - May 5, 2024
Oil Falls Below $80 - Traders Dumbfounded
Fast forward to today, oil is traded as low as $65/bbl before moving higher on the hopes of Chinese stimulus.
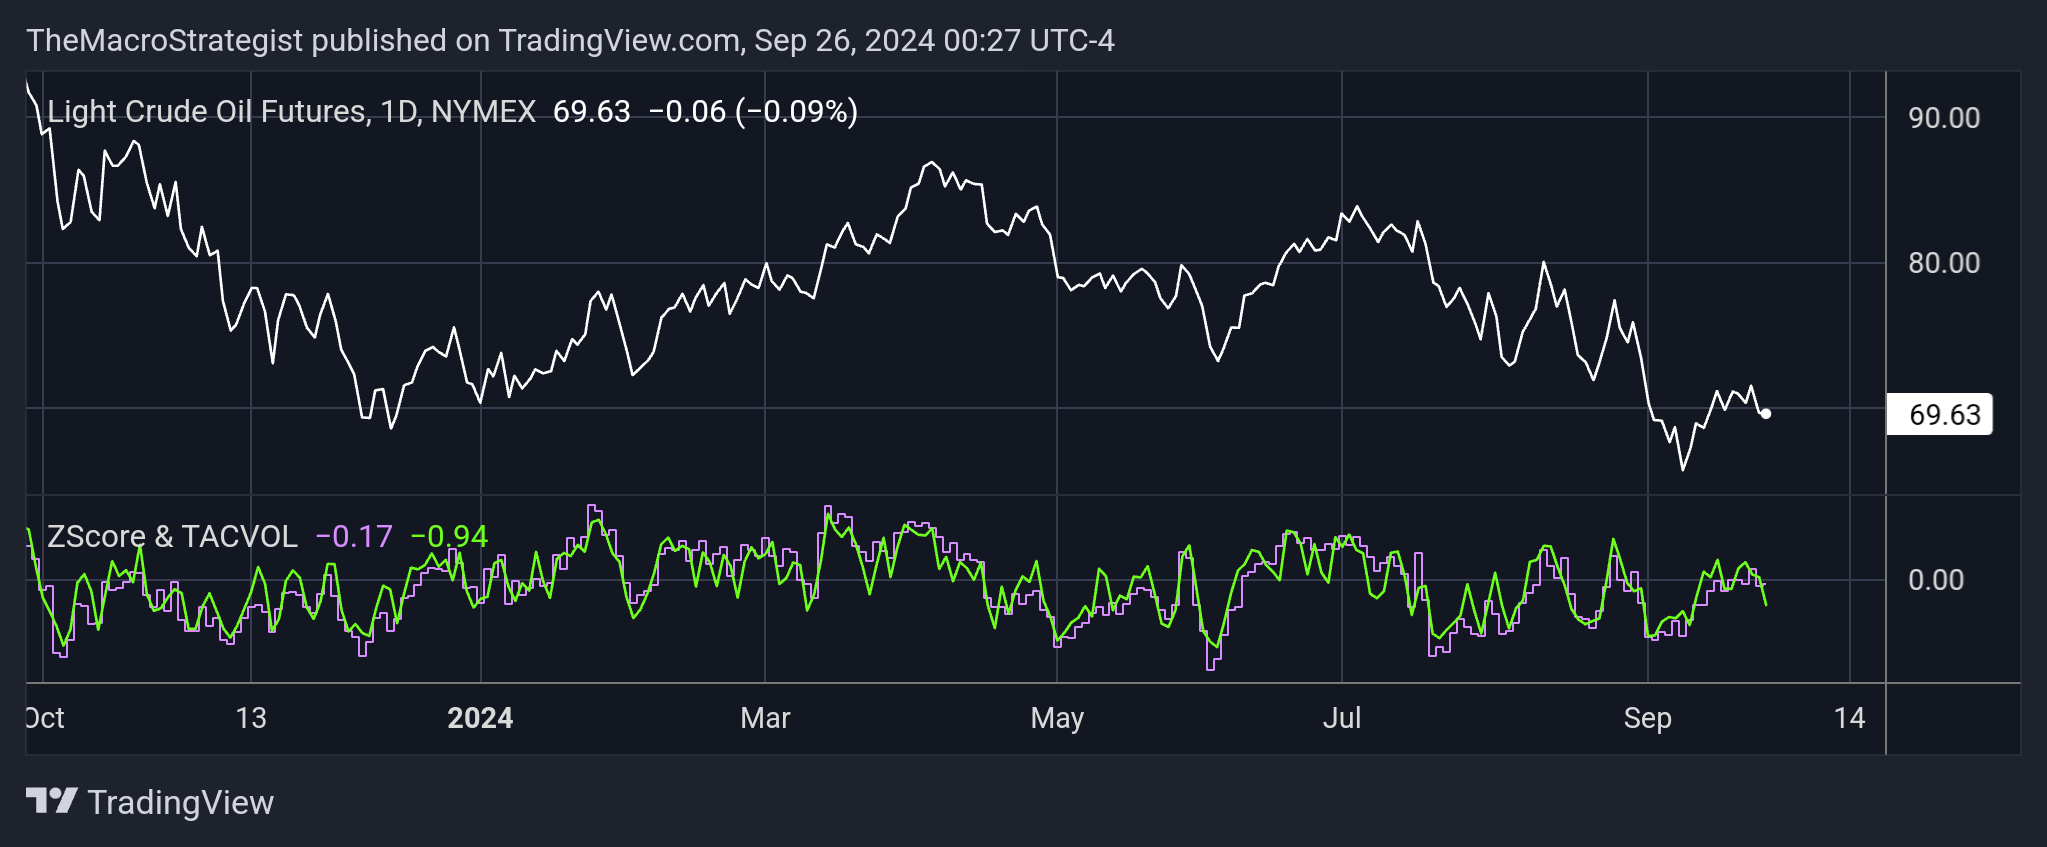
Oil is really telling. In previous macro inflection points, oil had always been a stubborn son-bitch when it comes to reacting to the economic reality of a global slowdown because oil has a very “human” component in that price is largely a reflection of traders’ feelings rather than the forward economic reality.
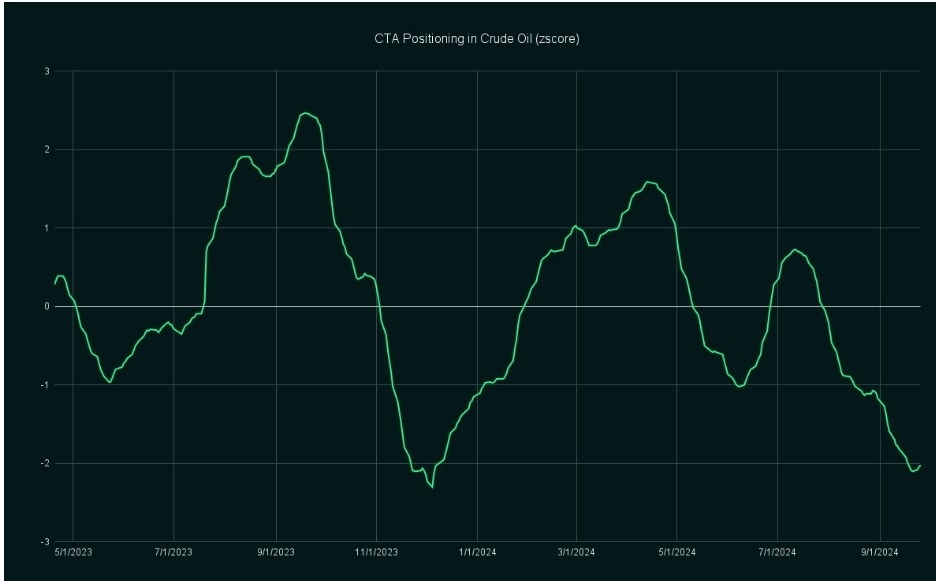
CTAs have unloaded a vast amount of crude exposure relative to their mean, which who could blame them. With that being said, when narratives like potential stimulus out of China floating around, crude may find a marginal bid. Intraday trend strength is fading quickly, though, as intermediate trend strength remains strongly negative.
Oil risk/return remains skewed to the upside with that lopsided Positioning with a probable 10.4% to the intermediate range top and 3.79% to the bottom range (74.98/65.47)

This time different? Nah, never is. Historically, every bond bull steepener out of inversion has resulted in vacuous losses for crude. Timing is the key distinction. However, if you are equipped with the understanding of what a bond bull leads into you won’t be caught off-sides.

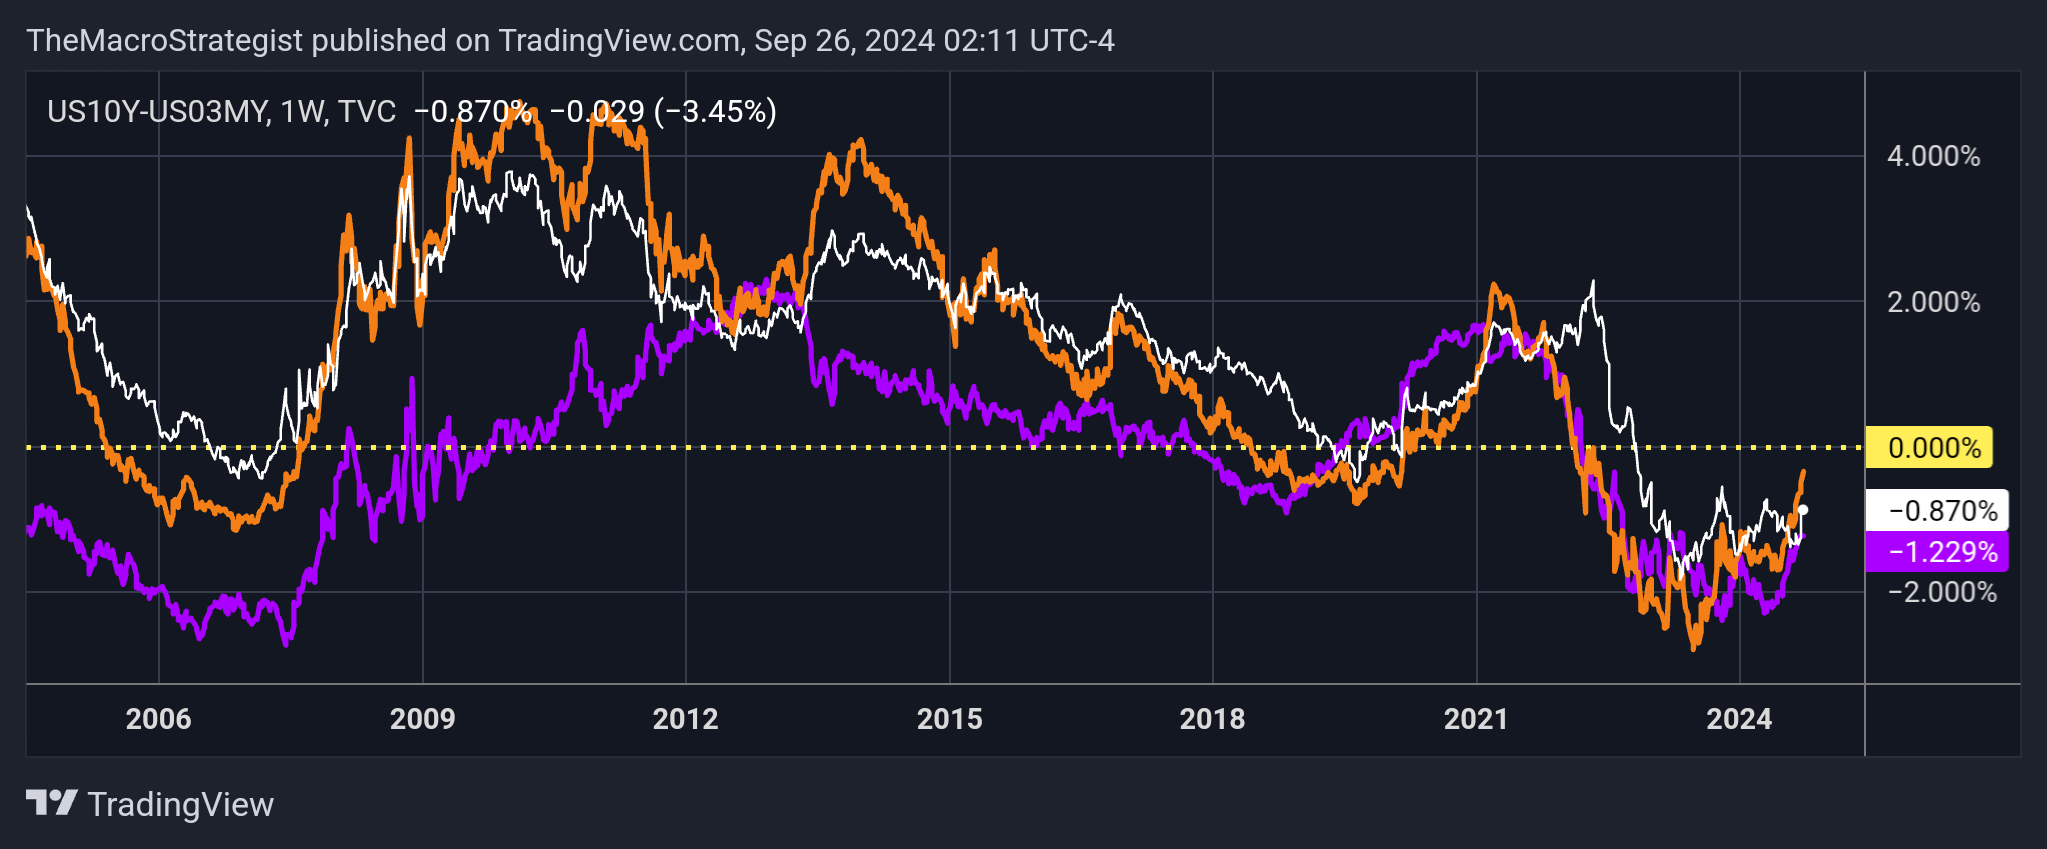
Why are yield curves important? Because they tend to lead into inflationary/disinflationary regimes; And because we’re grown men and women, we focus on inflation breakevens and NOT consumer prices. Inflation breakevens are market-based expectations of future inflation.
Breakevens are important because they are subtracted from nominal yields to create real yields. Real yields drive demand (or lack of demand) in interest-rate sensitive assets such as gold and bonds.
Falling breakevens are going to create demand in assets like gold and bonds. As nominal yields fall as expected inflation falls, this creates a positive feedback loop as real yields are driven lower.
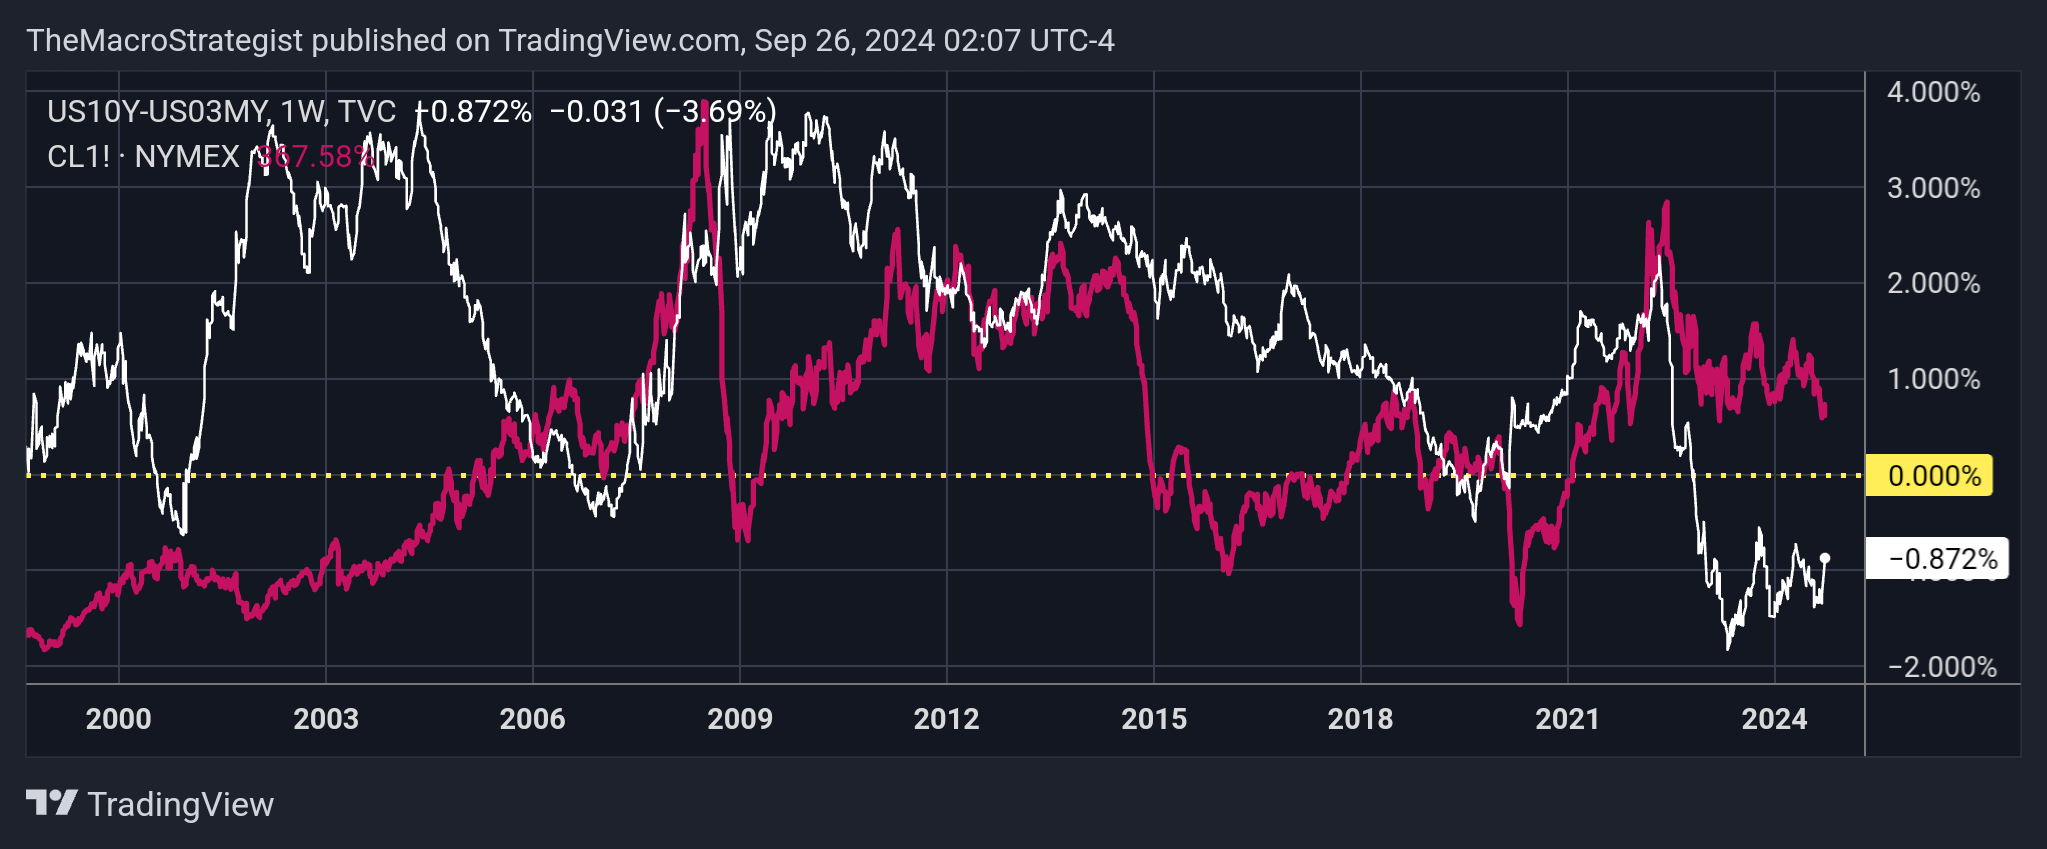
The 10s2s curve is often in the spotlight, but not enough is shed on the 10s3m curve. This curve tends to be more sticky, but it acts as the economic TKO. It’s uninversion signifies that a recession is here - done deal. What is troubling, now, is that its strong correlated to oil over the last year. By the time the 10s3m uninverts, oil could be trading into the mid-$50s.
The TMS rate sensitive proxy is in an upward trend which is a strong buying indicator for monetary policy and future demand for rate sensitive assets.

The rate sensitive is showing that even at $2,680 gold is still a strong buy. In fact, $3,300 is targeted after a pullback which I expect to occur late Q4-24 or early Q1-25.
This pullback will be created via a spike in real yields not because consumer prices are exceeding nominal yields, but nominal yields are going to plunge below consumer prices (liquidity event).
Gold is a horrendous inflation hedge. Does anyone stop to think why gold is so bullish in China? Jettison the bullshit notion of a Chinese-led, gold-backed BRICS currency and just realize that China is in outright deflation not inflation.
With Chinese yields collapsing to record lows, real yields are collapsing thus driving gold demand. Stop over-complicating with narratives du jour.
