Charts to Ponder: M2 and Velocity, What's Going On In Junk Yields?
Is a big disinflationary bust on deck?
First, let's look at the yen. It's down today after yesterday's carnage, but a lot of people were blaming the Bank of Japan's 15 bps hike.
However, the yen was already up 7% from it's all-time low over the two weeks leading into the BoJ hike. The Nikkei had already seen double-digit declines.
Did Buffet sell his holdings in five Japanese trading companies?
Tops and bottoms are not single day events but a process that can occur over some time.
Equities Reach All-Time Highs, But Are There Cracks?


This is something I have brought up previously, but the mentioning of M2 is making the rounds again. Yes, M2 supply is increasing but it's not going to have the effect you think it will.
For one, I talked about the relationship between Powell and Volcker. They are two of the same.
Volcker caved to the financial stress building underneath the surface despite saving face with rate hikes. Banks were on the verge of catastrophe, and Volcker opened the money supply floodgates. Back then, the Fed use to target M1 and M2, and Paul nearly doubled targets.
Is there any surprise M2 reignited after Silicon Valley Bank failed? This is not inflationary as it relates to consumer prices.
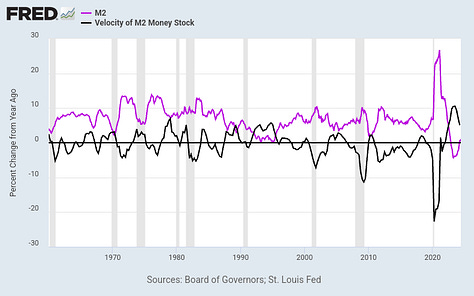
As you can see from the chart above, M2 and M2 velocity (M2V) are inversely correlated. M2 is not directly stimulatory, thus the for the call of a resurgence of consumer prices to spike, we need M2V to reaccelerate.
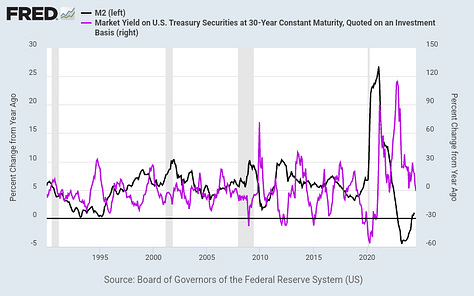
Furthermore, 30y yields are inverse of M2 (i.e. buy bonds). As money velocity comes down it makes treasuries far more attractive.
Banks have been buying bonds since last November which is a clear economic warning signal.
Banks have been the activators of the bond bull steepening that has lead into every major recession in modern age.


