
Chart of the Day: Gold Lingers as Real Yields Remain Elevated
Chart of the Day: Gold Lingers as Real Yields Remain Elevated
Despite all the misguided narratives surrounding the BRICS, gold is struggling under $2,000

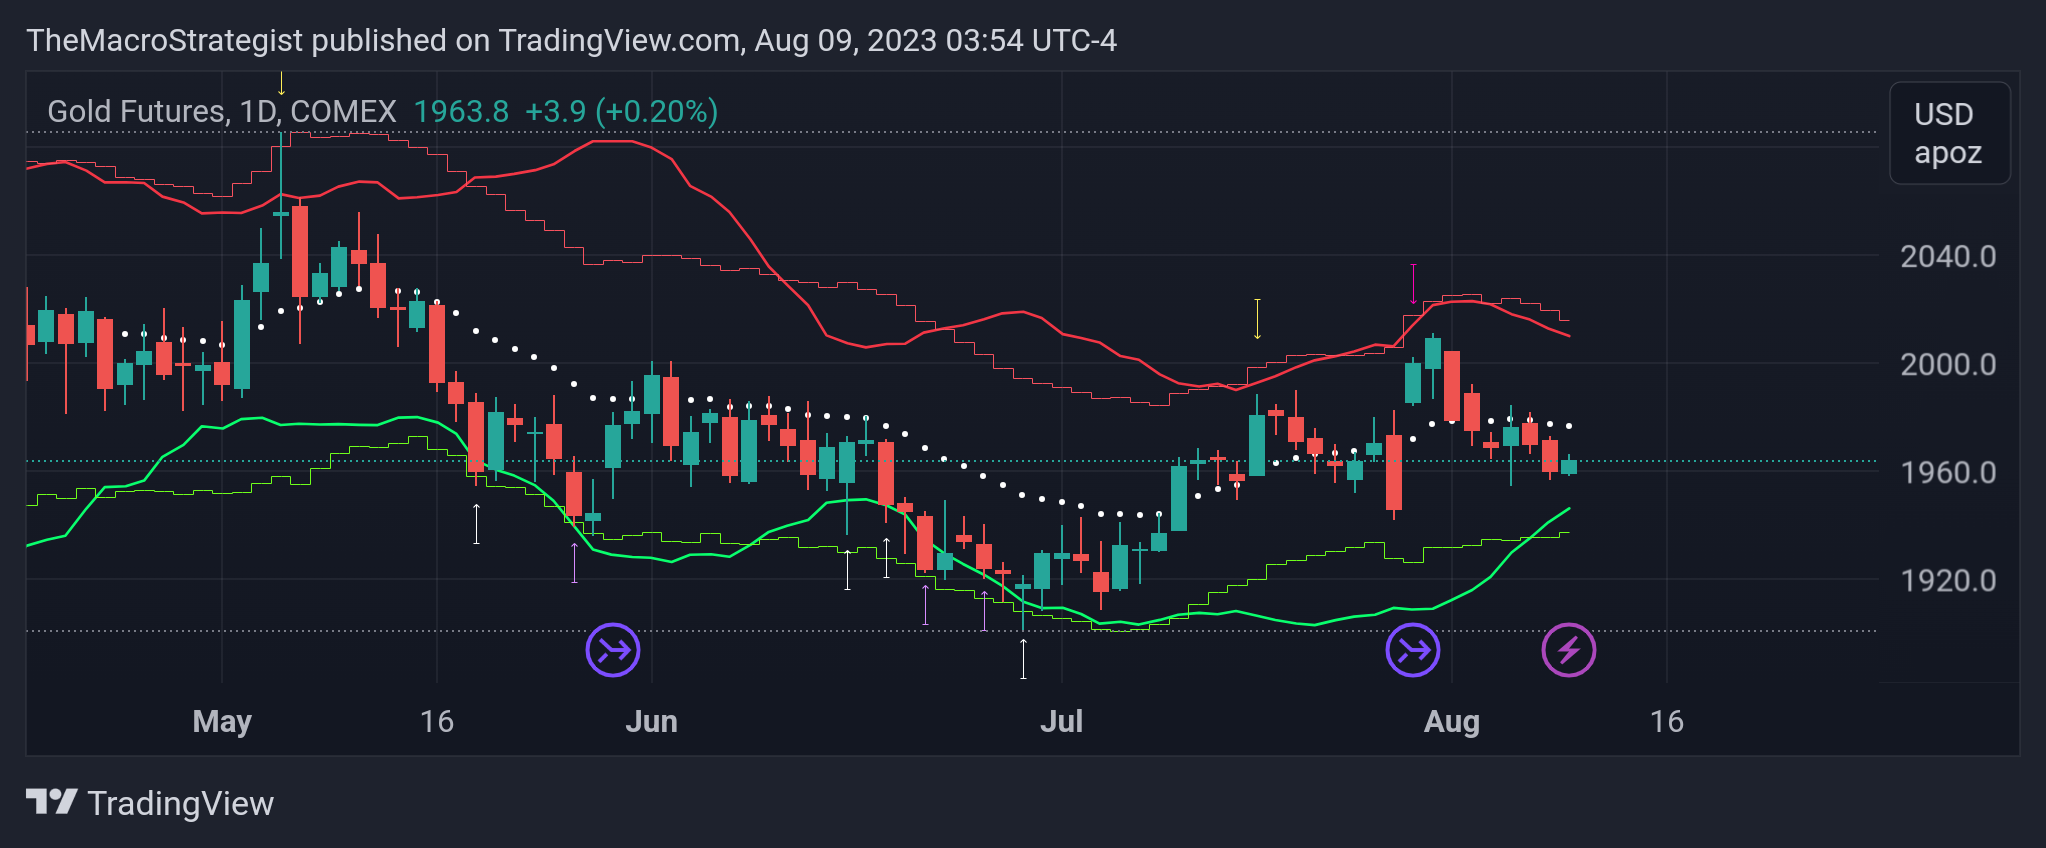
Gold is down 1.8% since the near-term reversal trigger was hit as price action remains choppy, effectively going nowhere over the last two months.
There is still media covering over the BRICS joint announcement, as gold bugs assume a gold-backed currency is in the works despite South Africa, India and Russia all saying there is no joint-currency agenda.
The reality is, with the yuan back above 7.2 per dollar and U.S. real yields hovering near cycle highs, gold traders may find it difficult to garner lasting momentum.
Additionally, I am forecasting that U.S. Treasury yields are beginning to top, particularly the short end and into the belly of the curve. The long end is expected to remain volatile near-term.
While lower yields, particularly real yields, will support gold, the initial bond bottoming process could hinder gold as capital is diverted.
Near-term range 2005.20/1936.40
you can back adjust the chart on tradingview. look at the right bottom.